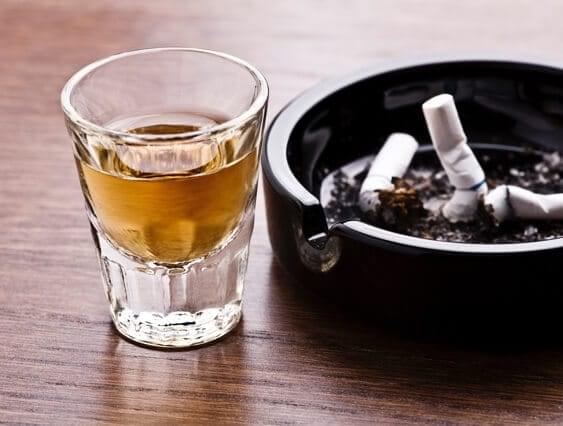
In the United States, substance abuse and substance use disorders affect all ages, races, genders and economic backgrounds.
Federal agencies collect, compile and distribute annual studies to help policymakers and public health officials evaluate prevention efforts and develop plans to combat substance abuse.
Drug Abuse Statistics
The vast majority of Americans have tried a substance of abuse — either tobacco, alcohol or an illicit drug — at least once in their lives. Alcohol is by far the most common substance of abuse. It’s followed by tobacco and marijuana as the top three substances of abuse in the nation.
Hard drugs such as hallucinogens and cocaine are the next-most-abused substances, followed by various prescription drugs.
Illicit Drug Stats
As expected with increasing legalization efforts across the country, marijuana consumption increased from 2013 to 2014. However, illicit drug use excluding marijuana remained about the same, and past-year and past-month prescription drug abuse rates decreased slightly.
Types of Illicit Drug Use Among
Americans 12 or older in 2013-2014
| Drug Name |
Lifetime (2013) |
Lifetime (2014) |
| Illicit Drug |
127,458,000 |
130,332,000 |
| Marijuana and Hashish |
114,712,000 |
117,213,000 |
| Cocaine |
37,634,000 |
39,200,000 |
| Crack |
8,870,000 |
9,424,000 |
| Heroin |
4,812,000 |
4,813,000 |
| Hallucinogens |
39,736,000 |
39,647,000 |
| LSD |
24,770,000 |
25,035,000 |
| PCP |
6,462,000 |
6,388,000 |
| Ecstasy |
17,815,000 |
17,548,000 |
| Inhalants |
21,068,000 |
21,293,000 |
| Prescription Drugs |
53,172,000 |
54,395,000 |
| Pain Relievers |
35,473,000 |
36,064,000 |
| OxyContin |
6,973,000 |
7,031,000 |
| Tranquilizers |
23,493,000 |
24,851,000 |
| Stimulants |
21,656,000 |
22,530,000 |
| Meth |
12,257,000 |
12,943,000 |
| Sedatives |
7,480,000 |
7,826,000 |
| Illicit Drugs Other than Marijuana |
78,076,000 |
80,119,000 |
| Drug Name |
Past year (2013) |
Past year (2014) |
| Illicit Drug |
41,591,000 |
44,157,000 |
| Marijuana and Hashish |
32,952,000 |
35,124,000 |
| Cocaine |
4,182,000 |
4,553,000 |
| Crack |
632,000 |
773,000 |
| Heroin |
681,000 |
914,000 |
| Hallucinogens |
4,430,000 |
4,250,000 |
| LSD |
1,111,000 |
1,290,000 |
| PCP |
90,000 |
90,000 |
| Ecstasy |
2,588,000 |
2,342,000 |
| Inhalants |
1,533,000 |
1,617,000 |
| Prescription Drugs |
15,348,000 |
14,966,000 |
| Pain Relievers |
11,082,000 |
10,337,000 |
| OxyContin |
1,442,000 |
1,237,000 |
| Tranquilizers |
5,269,000 |
5,202,000 |
| Stimulants |
3,492,000 |
3,715,000 |
| Meth |
1,186,000 |
1,301,000 |
| Sedatives |
639,000 |
775,000 |
| Illicit Drugs Other than Marijuana |
19,868,000 |
19,719,000 |
| Drug Name |
Past month (2013) |
Past month (2014) |
| Illicit Drug |
24,573,000 |
26,983,000 |
| Marijuana and Hashish |
19,810,000 |
22,188,000 |
| Cocaine |
1,549,000 |
1,530,000 |
| Crack |
377,000 |
354,000 |
| Heroin |
289,000 |
435,000 |
| Hallucinogens |
1,333,000 |
1,173,000 |
| LSD |
229,000 |
287,000 |
| PCP |
33,000 |
* |
| Ecstasy |
660,000 |
609,000 |
| Inhalants |
496,000 |
546,000 |
| Prescription Drugs |
6,484,000 |
6,537,000 |
| Pain Relievers |
4,521,000 |
4,325,000 |
| OxyContin |
492,000 |
356,000 |
| Tranquilizers |
1,705,000 |
1,875,000 |
| Stimulants |
1,365,000 |
1,595,000 |
| Meth |
595,000 |
569,000 |
| Sedatives |
251,000 |
330,000 |
| Illicit Drugs Other than Marijuana |
8,665,000 |
8,719,000 |
* No estimate reported or fewer than 100,000
Source: 2014 National Survey on Drug Use and Health
Back To Top
In 2014, almost half of all Americans reported abusing some kind of illicit drug during their lives. Nearly one third of Americans said they’d used an illicit drug other than marijuana.
Types of Illicit-drug Use Among
Americans 12 or Older in 2013-2014
| Drug |
Lifetime (2013) |
Lifetime (2014) |
| Illicit Drugs |
48.6% |
49.2% |
| Marijuana and Hashish |
43.7% |
44.2% |
| Cocaine |
14.3% |
14.8% |
| Crack |
3.4% |
3.6% |
| Heroin |
1.8% |
1.8% |
| Hallucinogens |
15.1% |
15.0% |
| LSD |
9.4% |
9.4% |
| PCP |
2.5% |
2.4% |
| Ecstasy |
6.8% |
6.6% |
| Inhalants |
8.0% |
8.0% |
| Prescription Drugs |
20.3% |
20.5% |
| Painkillers |
13.5% |
13.6% |
| OxyContin |
2.7% |
2.7% |
| Tranquilizers |
9.0% |
9.4% |
| Stimulants |
8.3% |
8.5% |
| Meth |
4.7% |
4.9% |
| Sedatives |
2.9% |
3.0% |
| Illicit Drugs Other than Marijuana |
29.8% |
30.2% |
| Drug |
Past year (2013) |
Past year (2014) |
| Illicit Drugs |
15.9% |
16.7% |
| Marijuana and Hashish |
12.6% |
13.2% |
| Cocaine |
1.6% |
1.7% |
| Crack |
0.2% |
0.3% |
| Heroin |
0.3% |
0.3% |
| Hallucinogens |
1.7% |
1.6% |
| LSD |
0.4% |
0.5% |
| PCP |
0.0% |
0.0% |
| Ecstasy |
1.0% |
0.9% |
| Inhalants |
0.6% |
0.6% |
| Prescription Drugs |
5.8% |
5.6% |
| Painkillers |
4.2% |
3.9% |
| OxyContin |
0.5% |
0.5% |
| Tranquilizers |
2.0% |
2.0% |
| Stimulants |
1.3% |
1.4% |
| Meth |
0.5% |
0.5% |
| Sedatives |
0.2% |
0.3% |
| Illicit Drugs Other than Marijuana |
7.6% |
7.4% |
| Drug |
Past month (2013) |
Past month (2014) |
| Illicit Drugs |
9.4% |
10.2% |
| Marijuana and Hashish |
7.5% |
8.4% |
| Cocaine |
0.6% |
0.6% |
| Crack |
0.1% |
0.1% |
| Heroin |
0.1% |
0.2% |
| Hallucinogens |
0.5% |
0.4% |
| LSD |
0.1% |
0.1% |
| PCP |
0.0% |
0.0% |
| Ecstasy |
0.3% |
0.2% |
| Inhalants |
0.2% |
0.2% |
| Prescription Drugs |
2.5% |
2.5% |
| Painkillers |
1.7% |
1.6% |
| OxyContin |
0.2% |
0.1% |
| Tranquilizers |
0.6% |
0.7% |
| Stimulants |
0.5% |
0.6% |
| Meth |
0.2% |
0.2% |
| Sedatives |
0.1% |
0.1% |
| Illicit Drugs Other than Marijuana |
3.3% |
3.3% |
* No estimate reported.
Source: 2014 National Survey on Drug Use and Health
Back To Top
Alcohol and Tobacco Stats
The number of tobacco users increased very slightly from 2013 to 2014, as did the number of people who reported consuming alcohol. The number of people who admitted binge drinking also increased slightly, but the number of heavy alcohol drinkers slightly decreased.
Tobacco and Alcohol Use Among
Americans 12 or Older
| Drug |
Lifetime (2013) |
Lifetime (2014) |
| Tobacco |
175,260,000 |
175,416,000 |
| Cigarettes |
162,138,000 |
161,789,000 |
| Smokeless Tobacco |
46,139,000 |
45,290,000 |
| Cigars |
89,117,000 |
89,267,000 |
| Pipe Tobacco |
34,173,000 |
33,695,000 |
| Alcohol |
213,794,000 |
217,765,000 |
| Binge |
– |
| Heavy |
– |
– |
| Drug |
Past Year (2013) |
Past Year (2014) |
| Tobacco |
80,846,000 |
81,141,000 |
| Cigarettes |
66,256,000 |
65,858,000 |
| Smokeless Tobacco |
11,866,000 |
11,559,000 |
| Cigars |
24,933,000 |
23,734,000 |
| Pipe Tobacco |
– |
– |
| Alcohol |
173,966,000 |
176,556,000 |
| Binge |
– |
– |
| Heavy |
– |
– |
| Drug |
Past Month (2013) |
Past Month (2014) |
| Tobacco |
66,879,000 |
66,899,000 |
| Cigarettes |
55,778,000 |
55,241,000 |
| Smokeless Tobacco |
8,813,000 |
8,662,000 |
| Cigars |
12,438,000 |
11,964,000 |
| Pipe Tobacco |
2,271,000 |
2,247,000 |
| Alcohol |
136,868,000 |
139,677,000 |
| Binge |
60,064,000 |
60,941,000 |
| Heavy |
16,541,000 |
16,342,000 |
– Not Available
Source: 2014 National Survey on Drug Use and Health
Back To Top
Although more people consumed tobacco products in 2014 than in 2013, the percentage of Americans who consumed them decreased. Alcohol consumption percentages remained about the same.
Tobacco and Alcohol Use Among Americans 12 or Older
| Drug |
Lifetime (2013) |
Lifetime (2014) |
| Tobacco |
66.8% |
66.2% |
| Cigarettes |
61.8% |
61.0% |
| Smokeless Tobacco |
17.6% |
17.1% |
| Cigars |
34.0% |
33.7% |
| Pipe Tobacco |
13.0% |
12.7% |
| Alcohol |
81.5% |
82.1% |
| Binge |
– |
– |
| Heavy |
– |
– |
| Drug |
Past year (2013) |
Past year (2014) |
| Tobacco |
30.8% |
30.6% |
| Cigarettes |
25.3% |
24.8% |
| Smokeless Tobacco |
4.5% |
4.4% |
| Cigars |
9.5% |
9.0% |
| Pipe Tobacco |
– |
– |
| Alcohol |
66.3% |
66.6% |
| Binge |
– |
– |
| Heavy |
– |
– |
| Drug |
Past month (2013) |
Past month (2014) |
| Tobacco |
25.5% |
25.2% |
| Cigarettes |
21.3% |
20.8% |
| Smokeless Tobacco |
3.4% |
3.3% |
| Cigars |
4.7% |
4.5% |
| Pipe Tobacco |
0.9% |
0.8% |
| Alcohol |
52.2% |
52.7% |
| Binge |
22.9% |
23.0% |
| Heavy |
6.3% |
6.2% |
– Not available
Source: 2014 National Survey on Drug Use and Health
Back To Top
Drug-Addiction and Treatment Stats
The number of people suffering from substance use disorders involving illicit drugs increased from 2013 to 2014, with notable increases in people suffering from cocaine addiction, heroin addiction and prescription drug addiction.
The number of people suffering from alcohol addiction decreased slightly overall and across all categorized age groups.
Past-Year Substance Use Disorder Among Americans 12 and Older 2013-2014
| Past-Year Substance Use Disorder |
Total (2013) |
Total (2014) |
| Illicit Drugs |
6,852,000 |
7,077,000 |
| Marijuana and Hashish |
4,206,000 |
4,176,000 |
| Cocaine |
855,000 |
913,000 |
| Heroin |
517,000 |
586,000 |
| Hallucinogens |
277,000 |
246,000 |
| Inhalants |
132,000 |
96,000 |
| Nonmedical Use of Psychotherapeutics |
2,281,000 |
2,417,000 |
| Pain Relievers |
1,879,000 |
1,918,000 |
| Tranquilizers |
423,000 |
472,000 |
| Stimulants |
469,000 |
476,000 |
| Sedatives |
99,000 |
143,000 |
| Alcohol |
17,298,000 |
16,994,000 |
| Both Illicit Drugs and Alcohol |
2,589,000 |
2,592,000 |
| Illicit Drugs or Alcohol |
21,561,000 |
21,480,000 |
| Past-Year Substance Use Disorder |
Ages 12-17 (2013) |
Ages 12-17 (2014) |
| Illicit Drugs |
875,000 |
867,000 |
| Marijuana and Hashish |
715,000 |
667,000 |
| Cocaine |
22,000 |
27,000 |
| Heroin |
10,000 |
18,000 |
| Hallucinogens |
63,000 |
55,000 |
| Inhalants |
41,000 |
39,000 |
| Nonmedical Use of Psychotherapeutics |
177,000 |
241,000 |
| Pain Relievers |
134,000 |
168,000 |
| Tranquilizers |
40,000 |
52,000 |
| Stimulants |
42,000 |
60,000 |
| Sedatives |
11,000 |
29,000 |
| Alcohol |
697,000 |
679,000 |
| Both Illicit Drugs and Alcohol |
270,000 |
296,000 |
| Illicit Drugs or Alcohol |
1,302,000 |
1,251,000 |
| Past-Year Substance Use Disorder |
Ages 18-25 2013) |
Ages 18-25 (2014) |
| Illicit Drugs |
2,557,000 |
2,320,000 |
| Marijuana and Hashish |
1,878,000 |
1,706,000 |
| Cocaine |
232,000 |
185,000 |
| Heroin |
182,000 |
168,000 |
| Hallucinogens |
147,000 |
120,000 |
| Inhalants |
47,000 |
14,000 |
| Nonmedical Use of Psychotherapeutics |
666,000 |
559,000 |
| Pain Relievers |
485,000 |
430,000 |
| Tranquilizers |
147,000 |
104,000 |
| Stimulants |
171,000 |
134,000 |
| Sedatives |
30,000 |
20,000 |
| Alcohol |
4,529,000 |
4,284,000 |
| Both Illicit Drugs and Alcohol |
1,073,000 |
908,000 |
| Illicit Drugs or Alcohol |
6,014,000 |
5,696,000 |
| Past-Year Substance Use Disorder |
Ages 26+ (2013) |
Ages 26+ (2014) |
| Illicit Drugs |
3,419,000 |
3,890,000 |
| Marijuana and Hashish |
1,612,000 |
1,804,000 |
| Cocaine |
601,000 |
702,000 |
| Heroin |
325,000 |
400,000 |
| Hallucinogens |
67,000 |
71,000 |
| Inhalants |
45,000 |
42,000 |
| Nonmedical Use of Psychotherapeutics |
1,438,000 |
1,617,000 |
| Pain Relievers |
1,260,000 |
1,320,000 |
| Tranquilizers |
236,000 |
316,000 |
| Stimulants |
256,000 |
281,000 |
| Sedatives |
58,000 |
94,000 |
| Alcohol |
12,072,000 |
12,032,000 |
| Both Illicit Drugs and Alcohol |
1,246,000 |
1,388,000 |
| Illicit Drugs or Alcohol |
14,245,000 |
14,534,000 |
Source: 2014 National Survey on Drug Use and Health
Back To Top
Past-Year Substance Use Disorder Among
Americans 12 and Older 2013-2014
| Demographic Characteristic |
Illicit drugs (2013) |
Illicit drugs (2014)
|
| Total |
6,852,000 |
7,077,000 |
| Age |
| 12-17 |
875,000 |
867,000 |
| 18-25 |
2,557,000 |
2,320,000 |
| 26 or older |
3,419,000 |
3,890,000 |
| Gender |
| Male |
4,278,000 |
4,422,000 |
| Female |
2,574,000 |
2,655,000 |
| Race or Ethnicity |
| Not Hispanic or Latino |
5,800,000 |
5,898,000 |
| White |
4,284,000 |
4,133,000 |
| Black or African-American |
1,045,000 |
1,313,000 |
| American Indian or Alaska Native |
69,000 |
40,000 |
| Native Hawaiian or other Pacific Islander |
30,000 |
53,000 |
| Asian |
171,000 |
157,000 |
| Two or more races |
202,000 |
200,000 |
| Hispanic or Latino |
1,051,000 |
1,180,000 |
| Demographic Characteristic |
Alcohol (2013) |
Alcohol (2014) |
| Total |
17,298,000 |
16,994,000 |
| Age |
| 12-17 |
697,000 |
679,000 |
| 18-25 |
4,529,000 |
4,284,000 |
| 26 or older |
12,072,000 |
12,032,000 |
| Gender |
| Male |
11,080,000 |
10,945,000 |
| Female |
6,218,000 |
6,049,000 |
| Race or Ethnicity |
| Not Hispanic or Latino |
14,306,000 |
14,080,000 |
| White |
11,539,000 |
11,059,000 |
| Black or African-American |
1,661,000 |
1,889,000 |
| American Indian or Alaska Native |
180,000 |
211,000 |
| Native Hawaiian or other Pacific Islander |
* |
66,000 |
| Asian |
491,000 |
511,000 |
| Two or more races |
361,000 |
344,000 |
| Hispanic or Latino |
2,992,000 |
2,915,000 |
| Demographic Characteristic |
Illicit drugs or alcohol (2013) |
Illicit drugs or alcohol (2014) |
| Total |
21,561,000 |
21,480,000 |
| Age |
| 12-17 |
1,302,000 |
1,251,000 |
| 18-25 |
6,014,000 |
5,696,000 |
| 26 or older |
14,245,000 |
14,534,000 |
| Gender |
| Male |
13,733,000 |
13,731,000 |
| Female |
7,828,000 |
7,749,000 |
| Race or Ethnicity |
| Not Hispanic or Latino |
18,006,000 |
17,867,000 |
| White |
14,291,000 |
13,721,000 |
| Black or African-American |
2,324,000 |
2,713,000 |
| American Indian or Alaska Native |
208,000 |
231,000 |
| Native Hawaiian or other Pacific Islander |
98,000 |
102,000 |
| Asian |
617,000 |
619,000 |
| Two or more races |
468,000 |
481,000 |
| Hispanic or Latino |
3,554,000 |
3,614,000 |
* No estimate reported.
Source: 2014 National Survey on Drug Use and Health
Back To Top
Almost 100,000 more people received treatment for substance use disorders in 2014 compared with 2013. About 2.4 million people received treatment for substance use disorders involving illicit drugs in 2014, up by about 200,000 compared with the year before.
Received Substance-Use Treatment in Past Year,
Ages 12 and older, Demographics 2013-2014
| Demographic Characteristic |
Drugs (2013) |
Drugs (2014) |
| Total |
2,214,000 |
2,440,000 |
| Age |
| 12-17 |
175,000 |
166,000 |
| 18-25 |
509,000 |
496,000 |
| 26 or older |
1,530,000 |
1,778,000 |
| Gender |
| Male |
1,281,000 |
1,462,000 |
| Female |
933,000 |
979,000 |
| Race or Ethnicity |
| Not Hispanic or Latino |
1,860,000 |
2,075,000 |
| White |
1,486,000 |
1,559,000 |
| Black or African-American |
272,000 |
435,000 |
| American Indian or Alaska Native |
28,000 |
22,000 |
| Native Hawaiian or other Pacific Islander |
9,000 |
11,000 |
| Asian |
27,000 |
19,000 |
| Two or More Races |
38,000 |
29,000 |
| Hispanic or Latino |
355,000 |
365,000 |
| Demographic Characteristic |
Alcohol (2013) |
Alcohol (2014) |
| Total |
2,731,000 |
2,683,000 |
| Age |
| 12-17 |
137,000 |
107,000 |
| 18-25 |
466,000 |
425,000 |
| 26 or older |
2,128,000 |
2,151,000 |
| Gender |
| Male |
1,747,000 |
1,768,000 |
| Female |
984,000 |
915,000 |
| Race or Ethnicity |
| Not Hispanic or Latino |
2,279,000 |
2,258,000 |
| White |
1,760,000 |
1,690,000 |
| Black or African-American |
319,000 |
427,000 |
| American Indian or Alaska Native |
45,000 |
37,000 |
| Native Hawaiian or other Pacific Islander |
9,000 |
7,000 |
| Asian |
68,000 |
35,000 |
| Two or More Races |
77,000 |
61,000 |
| Hispanic or Latino |
452,000 |
425,000 |
| Demographic Characteristic |
Both (2013) |
Both (2014) |
| Total |
1,320,000 |
1,427,000 |
| Age |
| 12-17 |
113,000 |
91,000 |
| 18-25 |
304,000 |
244,000 |
| 26 or older |
903,000 |
1,092,000 |
| Gender |
| Male |
774,000 |
867,000 |
| Female |
546,000 |
560,000 |
| Race or Ethnicity |
| Not Hispanic or Latino |
1,123,000 |
1,245,000 |
| White |
863,000 |
872,000 |
| Black or African-American |
169,000 |
320,000 |
| American Indian or Alaska Native |
28,000 |
16,000 |
| Native Hawaiian or other Pacific Islander |
9,000 |
4,000 |
| Asian |
25,000 |
14,000 |
| Two or More Races |
29,000 |
18,000 |
| Hispanic or Latino |
197,000 |
182,000 |
Source: 2014 National Survey on Drug Use and HealthBack To Top

Teen Drug Abuse Trends
The Monitoring the Future Survey conducted by the University of Michigan in partnership with the National Institute on Drug Abuse has collected information on high-school drug-abuse rates since 1975.
Lifetime prevalence of illicit drug use has fluctuated from highs in the late ’70s and early ’80s to steady decreases in the ’90s and a leveling off in the 2000s. Excluding marijuana, lifetime illicit drug use and alcohol consumption reached all-time lows in 2014.
- 1975: 55.2%
- 1980: 65.4%
- 1985: 60.6%
- 2005: 50.4%
- 2010: 48.2%
- 2011: 49.9%
- 2012: 49.1%
- 2013: 49.8%
- 2014: 49.1%
- 1975: 36.2%
- 1980: 38.7%
- 1985: 39.7%
- 1990: 29.4%
- 1995: 28.1%
- 2000: 29.0%
- 2005: 27.4%
- 2010: 24.7%
- 2011: 24.9%
- 2012: 24.1%
- 2013: 24.8%
- 2014: 22.6%
- 1975: 90.4%
- 1980: 93.2%
- 1985: 92.2%
- 1990: 89.5%
- 1995: 80.7%
- 2000: 80.3%
- 2005: 75.1%
- 2010: 71.0%
- 2011: 70.0%
- 2012: 69.4%
- 2013: 68.2%
- 2014: 66.0%
Drug-Related Costs
The financial impact of substance abuse is astronomical. The country loses billions of dollars every year in workplace productivity, unnecessary health care expenses, criminal justice expenditures and costs related to accidental injuries.
- Tobacco use cost the nation $289 billion to $332.5 billion annually from 2009 to 2012.
- Smoking-related illnesses cost the U.S. more than $300 billion in 2014.
- The estimated cost of excessive alcohol consumption was $223.5 billion in 2006, about $1.90 per drink.
- About 75 percent of alcohol-related costs are attributed to binge drinking.
- Substance use disorders cost the country an estimated $276 billion every year.
- Most costs come from lost work productivity and health care expenses.
Indirect Costs of Mental Health &
Substance Use Disorders in the U.S.
| Health Problem |
Indirect Cost |
Year of Estimate |
| Alcohol Abuse and Dependence |
$134 Billion |
1998 |
| Drug Abuse and Dependence |
$129 Billion |
2002 |
| Mental Health Disorders |
$94 Billion |
1992 |
Source: Substance Abuse and Mental Health Services Administration

Incarceration and Drug-Related
Arrest Statistics
In 2014, drug-related charges were the most common reason for arrests.
- 1.5 million for drug-abuse violations.
- 1.1 million for driving under the influence.
- 414,000 for drunkenness.
- 321,000 for liquor-law violations.
Nationally, marijuana possession was the most common drug abuse violation. Only 17 percent of federal drug-related arrests were for drug trafficking.
Arrests for drug-abuse violations,
percentage distribution by region, 2014
| Drug-abuse violations |
U.S. |
| Heroin or Cocaine and Their Derivatives |
5.8% |
| Marijuana |
5.2% |
| Synthetic or Manufactured Drugs |
1.9% |
| Other Dangerous Nonnarcotic Drugs |
4.1% |
| Total Sales and Manufacturing |
16.9% |
| Heroin or Cocaine and Their Derivatives |
17.0% |
| Marijuana |
39.7% |
| Synthetic or Manufactured Drugs |
4.8% |
| Other Dangerous Nonnarcotic Drugs |
21.5% |
| Total Possession |
83.1% |
| Drug-abuse violations |
Northeast |
| Heroin or Cocaine and Their Derivatives |
12.0% |
| Marijuana |
5.6% |
| Synthetic or Manufactured Drugs |
1.4% |
| Other Dangerous Nonnarcotic Drugs |
2.4% |
| Total Sales and Manufacturing |
21.4% |
| Heroin or Cocaine and Their Derivatives |
18.6% |
| Marijuana |
44.0% |
| Synthetic or Manufactured Drugs |
3.6% |
| Other Dangerous Nonnarcotic Drugs |
12.4% |
| Total Possession |
78.6% |
| Drug-abuse violations |
Midwest |
| Heroin or Cocaine and Their Derivatives |
3.7% |
| Marijuana |
8.1% |
| Synthetic or Manufactured Drugs |
1.2% |
| Other Dangerous Nonnarcotic Drugs |
4.8% |
| Total Sales and Manufacturing |
17.8% |
| Heroin or Cocaine and Their Derivatives |
10.1% |
| Marijuana |
52.0% |
| Synthetic or Manufactured Drugs |
4.8% |
| Other Dangerous Nonnarcotic Drugs |
15.2% |
| Total Possession |
82.2% |
| Drug-abuse violations |
South |
| Heroin or Cocaine and Their Derivatives |
5.2% |
| Marijuana |
4.5% |
| Synthetic or Manufactured Drugs |
3.5% |
| Other Dangerous Nonnarcotic Drugs |
3.8% |
| Total Sales and Manufacturing |
16.9% |
| Heroin or Cocaine and Their Derivatives |
13.9% |
| Marijuana |
49.6% |
| Synthetic or Manufactured Drugs |
7.2% |
| Other Dangerous Nonnarcotic Drugs |
12.4% |
| Total Possession |
83.1% |
| Drug-abuse violations |
West |
| Heroin or Cocaine and Their Derivatives |
3.9% |
| Marijuana |
4.3% |
| Synthetic or Manufactured Drugs |
0.5% |
| Other Dangerous Nonnarcotic Drugs |
5.0% |
| Total Sales and Manufacturing |
13.8% |
| Heroin or Cocaine and Their Derivatives |
24.1% |
| Marijuana |
17.1% |
| Synthetic or Manufactured Drugs |
2.5% |
| Other Dangerous Nonnarcotic Drugs |
42.5% |
| Total Possession |
86.2% |
Source: FBI
Back To Top
Since the beginning of the war on drugs in the 1970s, the number of people incarcerated in the United States had risen significantly every decade. The number of inmates in federal prisons because of drug charges has recently begun to decline.
- 1980: 4,749
- 1985: 9,491
- 1990: 24,297
- 1995: 46,667
- 2000: 74,276
- 2005: 87,800
- 2010: 97,800
- 2014: 95,500
In January 2016, almost 50 percent of all federal inmates in the country were serving sentences for drug-related convictions.
Federal-Prison Inmates in the United
States, January 2016
| Offense |
Number of Inmates |
| Drug |
85,353 |
| Weapons, Explosive, Arson |
31,088 |
| Immigration |
16,809 |
| Sex Offenses |
14,429 |
| Extortion, Fraud, Bribery |
11,983 |
| Burglary, Larceny, Property Offenses |
8,013 |
| Robbery |
6,982 |
| Homicide, Aggravated Assault, and Kidnapping Offenses |
5,552 |
| Miscellaneous |
1,486 |
| Courts or Corrections |
775 |
| Banking and Insurance, Counterfeit, Embezzlement |
636 |
| Continuing Criminal Enterprise |
430 |
| National Security |
72 |
| Offense |
Percentage of Inmates |
| Drug |
46.5% |
| Weapons, Explosive, Arson |
16.9% |
| Immigration |
9.2% |
| Sex Offenses |
7.9% |
| Extortion, Fraud, Bribery |
6.5% |
| Burglary, Larceny, Property Offenses |
4.4% |
| Robbery |
3.8% |
| Homicide, Aggravated Assault, and Kidnapping Offenses |
3.0% |
| Miscellaneous |
0.8% |
| Courts or Corrections |
0.4% |
| Banking and Insurance, Counterfeit, Embezzlement |
0.3% |
| Continuing Criminal Enterprise |
0.2% |
| National Security |
0.0% |
Source: Federal Bureau of Prisons
Back To Top
Medical Disclaimer: DrugRehab.com aims to improve the quality of life for people struggling with a substance use or mental health disorder with fact-based content about the nature of behavioral health conditions, treatment options and their related outcomes. We publish material that is researched, cited, edited and reviewed by licensed medical professionals. The information we provide is not intended to be a substitute for professional medical advice, diagnosis or treatment. It should not be used in place of the advice of your physician or other qualified healthcare provider.